#ParisAttacks - How Twitter tells the story
This is an analysis of Twitter's hashtags after the week-end. I used a website (www.takwalker.com) to get the data. The dataset is aggregated for each hour of each days from Friday 13rd November 2015 to today. I chose to try to tell the story with Twitter's data.
Feel free to leave a message or a note about this work.Why this data-visualisation?
I did this data-visualisation because I was really moved by all these attacks. Victims were in my age group… I live in Paris Xe so it was in my neighbourhood… I love going to concerts, drinking a beer with friends… being alive finally ! It was a way for me to pay tribute to victims.Why these data?
I chose to use aggregated data because I did not have so much time. But I was really interested by row data with geolocations, users… I was also interested by retweets and bookmarks. In fact I would have loved to have each tweet… But as I told before, I did not have so much time.Why did I choose a red color palette for all the story?
It was difficult for me to choose a design. I tried different palettes but none was good enough. When I tried the red palette, I told myself « Wow ! This is really agressive ! » and I thought about it a long time. I chose to use this even if it is agressive because, indeed, #ParisAttacks were really agressive… When my colleagues and friends looked at my visualization, they told me that there is too much red and it is agressive. I told them that it is the aim of red palette. I want readers to have the same feeling than me about #ParisAttacks. Apparently, it is working...Why did I choose a story?
First I tried to do the visualisation in a one page presentation. But when I looked at the data and how hashtags move, I told myself a story could be a good solution. So I put annotations, corresponding to events Firday night, to comment hashtags’ variations.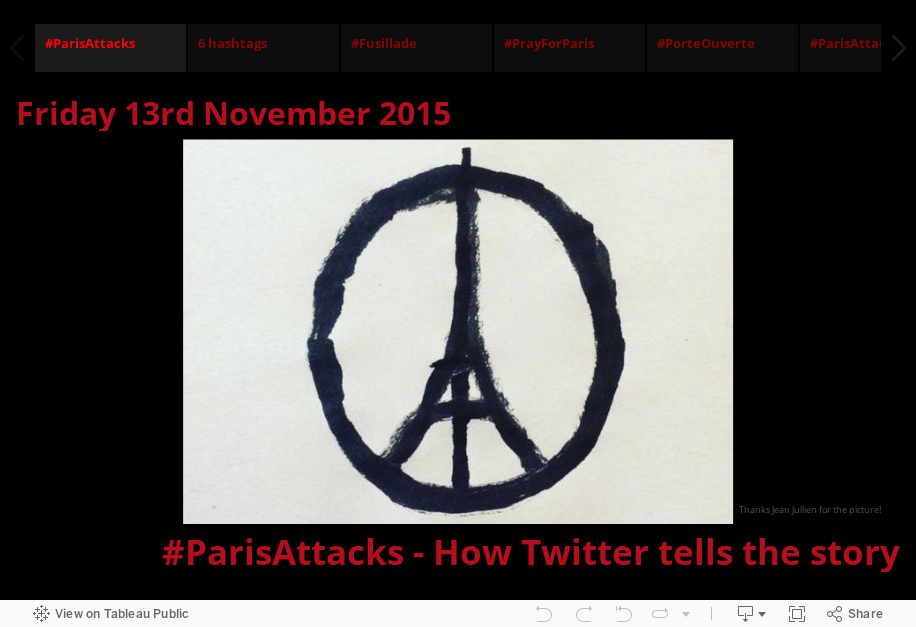
Thank you!
Nice viz. Bold decision to choose red. It made the viz bolder
ReplyDeleteThis comment has been removed by the author.
ReplyDeleteMay I ask how and where you found your data ?
ReplyDeleteHi Jonathan, I took this viz as my inspiration to create viz for the recent Jakarta attacks. Thanks for sharing this!
ReplyDeleteHi, this looks fantastic. Would it be possible to access the data? My programming skills are not good enough to do this. Many thanks
ReplyDeleteJust wish to say your article is as surprising.
ReplyDeleteThe clarity to your post is simply great and that i could
suppose you’re a professional on this subject.
Well with your permission let me to clutch your feed to stay up to date with approaching post.
Thank you a million and please continue the rewarding
work.
Tableau Guru
www.sqiar.com
very curious to know how you collected the data.. please tell us if you used any tools to collect the data.
ReplyDeleteVery nice viz!!
ReplyDeleteI wonder if you share/would like to share your dataset (tweet ids)? Do you observe a sharp drop between 23:30 to 00:14 when you aggregate by minute? In a similar dataset, we observe this behavior and trying to find out if it was a common problem by comparing different datasets.
Thanks in advance,
Bests
ZP
Dear Jonathan, I would like to cite your project in my MFA thesis paper for Northeastern University's Information Design and Visualization program. Is there any way I can get in touch with you for more information on this project?
ReplyDeleteLia Petronio
Hi Lia ! Thanks for your comment ! I will be proud to be in your paper. You can get in touch with me by twitter if you want with a DM @j_trajkovic.
DeleteLooking forward to hearing you !
JonathanT.
Nice job! Did you get the aggregated data for free from talkwalker?
ReplyDeleteThis comment has been removed by the author.
ReplyDeleteThis comment has been removed by the author.
ReplyDelete