Analysis of Airbnb data
Thanks to Jewel Loree from Tableau Public, I found a dataset about Airbnb. The timing was excellent because I had to choose an Airbnb accomodation for a training in Luxembourg a few weeks ago. When I discovered the website Inside Airbnb, I was suprised to find a lot of CSV files concerning several cities around the world. As a French, I chose to start my analysis with Paris but actually, I downloaded all the files to build the visualisation below.
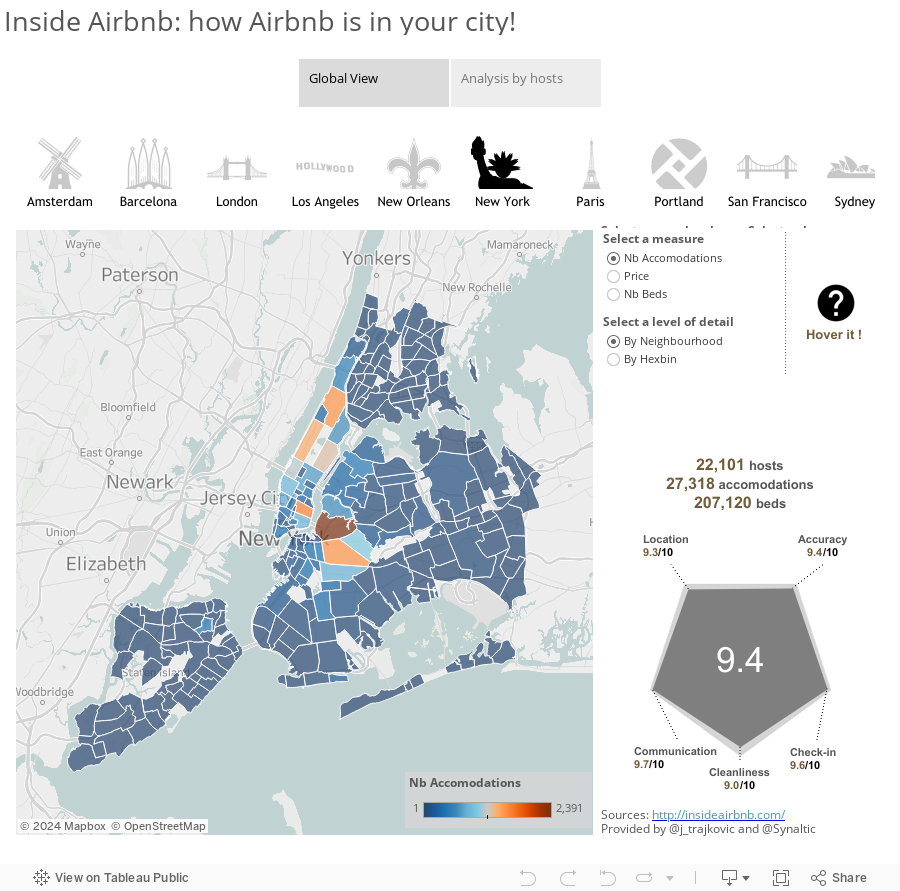
The visualisation is built in 2 parts. The first part called "Global view" try to present the data from 10 cities with a map and a radar graph. The map is available in two types: by neighbourhood and by hexbin. To draw hexbin, I used the method describe by The Last Data Bender wich allow to use polygon and no shape (I think it is more flexible and beautiful). The second part is about hosts. I chose to show how the accomodations are distributed by hosts and by city. In this part, each accomodation is located on a map and the Airbnb URL is available.
Don't hesitate to leave a message or a note about this work.
Source: InsideAirbnb - Get the data
Thank you for the reading!
Airbnb provides you a unique experience to travel around the globe for affordable getting a good feel for each town you stay in by staying in a very different atmosphere than a hotel.
ReplyDeleteHorner,
Foocy
Just wish to say your article is as surprising.
ReplyDeleteThe clarity to your post is simply great and that i could
suppose you’re a professional on this subject.
Well with your permission let me to clutch your feed to stay up to date with approaching post.
Thank you a million and please continue the rewarding
work.
Tableau Guru
www.sqiar.com
Very good post, I enjoyed reading your post very much, I want to retweet this to my followers.폭스나인
ReplyDelete스웨디시